
Does the common CS conference publication model with a fixed low acceptance rate over submissions make sense? What are some consequences of it? Here, I analyze some interesting properties that model the reviewing and acceptance system of machine learning conferences, but applies to CS more generally.
Disclaimer: This is a toy model and more knowledgeable people have devoted greater effort to other models and ideas [1, 2, 3, 4, 5], among many others. Below there is simple and to-the-point food for thought. I don’t know yet if I consider these conclusions based on simplified models to be valid for the real case.
The ideal case: no giving up
First, let’s assume that authors keep resubmitting their unaccepted papers indefinitely, without restrictions on how papers are accepted.
Assume a sequence of non-overlapping conference calls (e.g. 3 per year), and each time $\N$ new papers are added to the pool of papers to be published, and we let $\p \in (0, 1]$ be a fixed rate of acceptance.1 The pool of unaccepted papers evolves like the following dynamical system for $x_1 \gets \N$:
\[x_{t+1} \gets x_t (1-\p) + \N.\]This converges fast to a fixed point $\xast$, which is the solution to $\xast = \xast(1-\p) + \N$, yielding
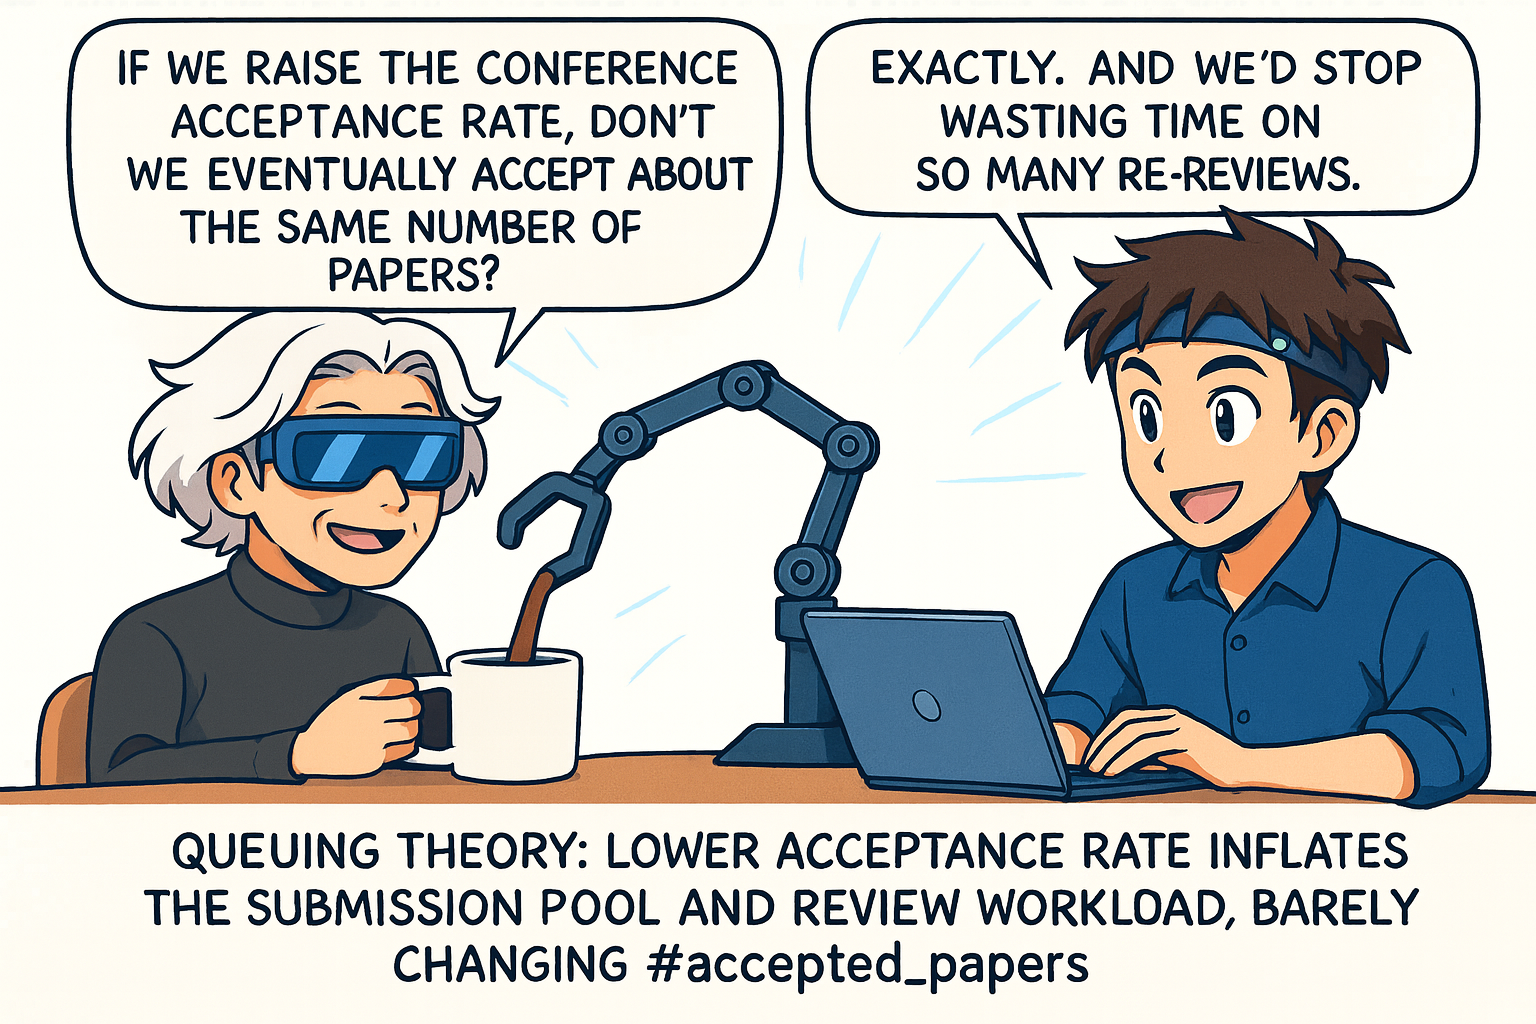
\[\xast = \frac{\N}{\p},\] \[\textit{#accepted_papers}= \xast \cdot \p = \frac{\N}{\p} \cdot \p = \N.\]Amazing!! #accepted_papers does not change with $\p$. If we reduce $\p$, the only effect is that the pool size grows until it’s so big that a fraction $\p$ of it ends up being the same number of papers $\N$, and we review more for nothing $(\propto \N/\p)$. We’d accept the same amount of papers in each conference! More easily: at the fixed point the number of papers that come in must be the number of papers that come out, that is $\N$. In fact Little’s Law from queueing theory implies this fact and further generalizations. So:
Now, what happens if authors do give up?
If authors give up
We model papers of three different qualities. The results are similar to before for a relevant interval for $\p$. The simulations yield that a decrease in the rate of acceptance from 35% to 20% increases the number of abandoned bad papers comparably to changing their wait in the pool for two or three rounds. At the same time, it increases the pool size and reviewing load by about 46%, for $\T=6$. With the slider, you’ll be able to see other cases. How faithful the model is would require further investigation. But one possible conclusion from it could be:
Here is the model, inspired by the previous 2014 and 2021 Neurips experiments. Assume there are $\N=5000$ new papers for a sequence of non-overlapping conferences, and we have: great papers, average papers, and bad papers in proportion of 15% / 70% / 15%. We model this by assigning them a probability of acceptance proportional to $15, 5$ and $1$, respectively.
At each iteration, we approximate the number of papers in each category that should be accepted, given the quality weights of each category, until we accept a fraction $\p$ of them. Then, we remove them from the pool, and consider them accepted. If a paper stays in the pool for $\T$ iterations, it is removed.
The following plot shows the percentage of papers in each category that end up abandoning the pool out of all the papers produced in that category, depending on the rate $\p$, at the system’s equilibrium. Note that the acceptance plot would be the reverse one: papers that are not abandoned are accepted. The second plot is the same but zooming on $\p \in [0.2, 0.35]$. If we compare $p=0.2$ with respect to $p=0.35$ for $\T=6$, the number of bad papers abandoned increases from ~60% of the total bad papers to ~77% but for average papers it increases 478% from ~4% to ~24% (and recall there are around 5 times as much average papers as bad papers so the absolute effect is bigger). At the same time reviewing load increases 46%, because the pool still increases to something close to $\N / \p$. The numbers change a bit with the value of the uncontrolled variable $\T$. Test it yourself with the slider.
Below, you can see how the size of the pool changes significantly with $\p$. Recall in the ideal case it’s $\N/\p$ and here it is close to it. Do you observe 20K+ submissions on a conference? You are actually seeing ~$\N / \p$, not $\N$, there is a big difference!
In other words, there is of course, some trade-off. Lower rate of acceptance in this less-idealized case does imply more papers abandon the system and prevents some of the bad papers to get in, but at the expense of significant extra reviewing costs and affecting more to average papers that are left out just by bad luck. See for instance this case of NeurIPS 2025 where some area chairs were asked to reject papers with good reviews, just to meet a low $\p$. I’ve heard arguments saying that in Machine Learning conferences a higher $\p$ would make the conferences too big for any venue, but this does not take into account that higher rate of acceptance has a reduction effect on the pool of unaccepted papers and does not change absolute acceptances dramatically. And in any case, there are other solutions worth considering such as federated conferences and other models (with an attempt from the second NeurIPS 2025 location and the European NeurIPS 2025 Hub, see also The AI Conference Bubble is About to Burst). Of course, one should be aware that a lower bar could encourage people to submit weaker papers. Also, as you can see in the appendix, the right metric to have in mind is that of effective acceptance rates for these systems. And note that these effective rates can be played by authors by increasing their $\T,$ which only increases the reviewing load.
Any process designed for people will be inherently flawed. But what feels clear to me is that we currently need some changes and this should most likely require:
- Getting people to ask what the community needs and wants.
- Making quick reviewing experiments outside of conferences to iterate faster. Trusty quick-iteration methods can be borrowed from game development and usability research.
- Being mindful of resources (papers do not need to have 4-5 reviewers).
- Don’t be afraid of (tested) change.
What are your thoughts on this? What do you think about this post’s model? Would you change anything about where we stand in the trade-off?
@misc{martinezrubio-2025-queuing-to-publish
  title = {Queueing to publish in AI (and CS)},
  author    = {Mart{\'\i}nez-Rubio, David and Pokutta, Sebastian},
  year = {2025},
  month = {09},
  howpublished = {Blog post},
  url = {https://damaru2.github.io/general/queueing_to_publish_in_AI_or_CS/},
}
Bonus - Interactive Appendix
- Check the post in Sebastian’s blog for the relevant math on Queueing Theory and a cool funnel simulation.
- Simulation. The system essentially stabilizes after $\T+1$ iterations. One can observe other natural phenomena, such as a great reduction in the absolute number of average papers that were rejected merely due to bad luck wrt the others, when $\p$ increases to $0.35$. One can observe how much the black line of waiting papers decreases when acceptance rate is increased.
-
Growth over time. You can also play with what happens if you assume a $2\%$ growth by checking this box , but the conclusions are essentially the same since the new equilibria are tracked fast. Note that the observed growth in submitted papers is approximately that $2\%$ as well but this number is approximately $1/\p$ times the new papers that are produced. Huge submission counts are inflated by acceptance rates.
-
Real acceptance rate: much higher than one conference’s rate, since authors resubmit. Clearly not 20% of newly produced papers are accepted if $\p=0.2$. Every conference, we’d actually accept 20% of a pool that has been artificially inflated by rejecting many previous papers. Below you can see the final acceptance rate if authors only give up after $\T$ iterations: the area under the curve shows contributions by quality. Compare how it changes with $\T$ using the slider.
- Quality of accepted / abandoned papers: On the first plot, we show the categories for the overall accepted paper count given $\p$, in percentage. On the second plot, we show the same for abandoned papers. Lower acceptance rate (that increases the pool size and reviewer load) generally increases the quality of both accepted and abandoned papers, in proportion. Also, fact: For large $\T$, when $\p \to 1$ in the first case or $\p\to 0$ in the second, it’s essentially the 15%–70%–15% split of the original distribution.
Acknowledgements: We want to thank José Céspedes Martínez for proofreading and writing suggestions.